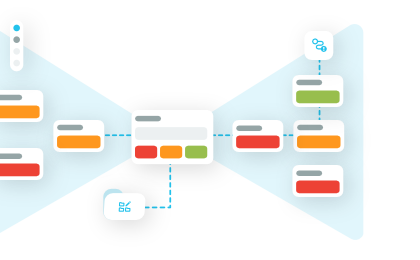
When it comes to risk management, clarity is everything. If a tool is too dense, stakeholders tune out; if it’s too simple, crucial safeguards get missed. Enter the Bow-Tie Method - one of the most effective tools in modern risk analysis. It’s complex enough to satisfy rigorous enterprise standards, yet simple enough that anyone in your organisation can understand it at a glance.
What is the Bow-Tie method?
Named after its distinctive shape, the Bow-Tie model evolved from cause-and-consequence diagrams in the 1970s before being formally adopted by Shell Group in the 1990s. Today, it is widely used across safety-critical industries, financial services, and enterprise risk management (ERM).
Traditional risk matrices often compress complex scenarios into a single score. In contrast, the Bow-Tie diagram exposes the entire causal pathway - showing how multiple potential causes converge into a single risk event, and how that event can branch out into various real-world consequences.
Anatomy of a Bow-Tie diagram
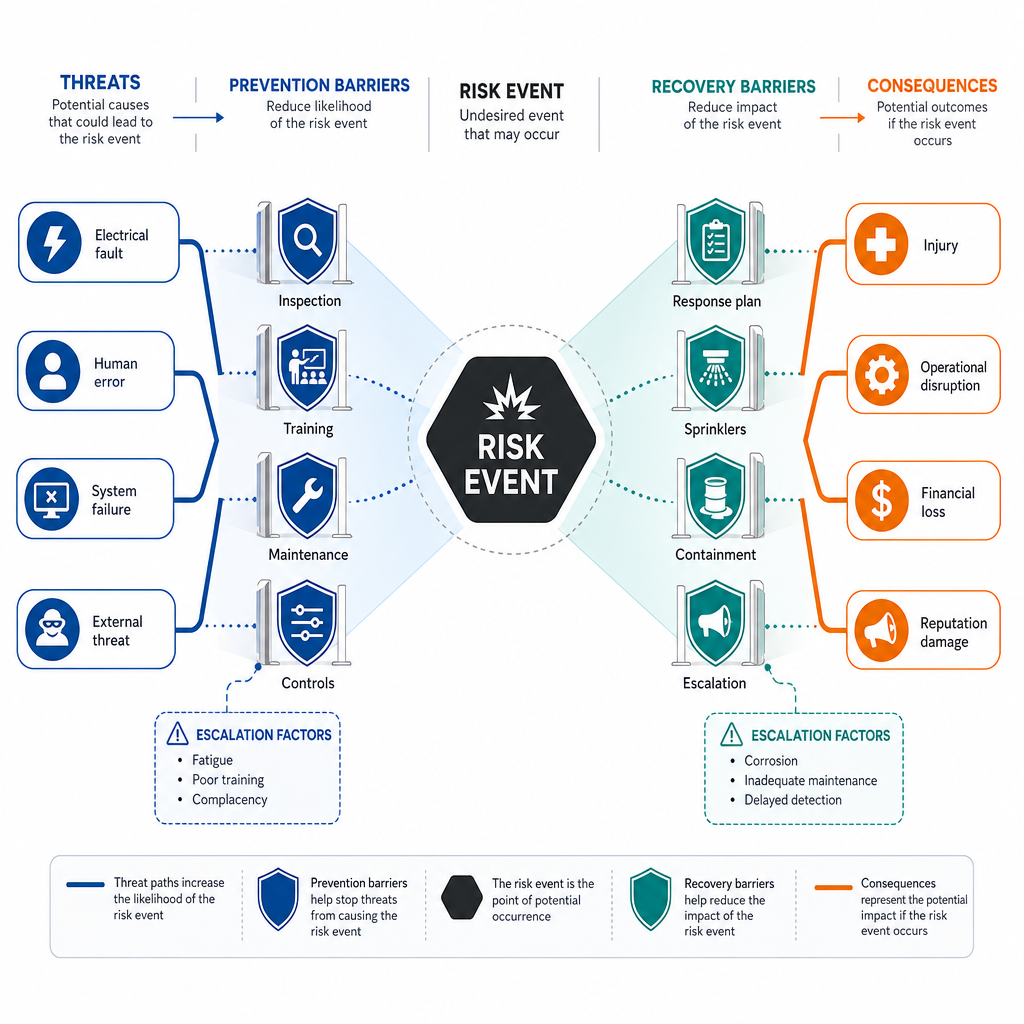
The diagram centres on a single point of focus and expands outward on both sides:
1. The centre knot (The risk event)
At the very centre of the diagram sits the central Risk Event—the moment control is lost (for example, a factory fire, a data breach, or a supply chain disruption).
2. The left side (Prevention & likelihood controls)
- Sources / Threats: The initiating causes that could trigger the event (e.g., electrical faults, arson, or lightning strikes).
- Likelihood Controls (Barriers): Intervening safeguards placed between the threat and the event to stop it from happening in the first place (e.g., flame-retardant storage, routine electrical inspections).
3. The right side (Recovery & consequence controls)
- Consequences: The potential bad outcomes if the event actually occurs (e.g., structural damage, injury, financial loss).
- Consequence Controls (Mitigations): Post-event measures designed to limit the severity of the impact (e.g., automatic sprinkler systems, fire doors, emergency response plans).
4. Escalation factors
No control is 100% foolproof. Escalation Factors are conditions that can weaken or disable your primary controls—such as human fatigue, corrosive environments, equipment age, or lack of training.
Example: A salt-water corrosive environment on an offshore rig might cause fire detection sensors to fail. To counter this escalation factor, you introduce a secondary control—such as increased inspection frequency and regular testing.
Why use the Bow-Tie method?
While Bow-tie analysis is typically associated with hazards, it works equally well for opportunity management.
When launching a new business or launching a financial product, the left side represents potential opportunities and driving forces, while the right side maps out positive returns, brand growth, or operational scaling. In complex projects, both positive and negative outcomes can even be mapped around a shared focal event to evaluate total risk vs. reward.
For high-stakes enterprise projects, a visual diagram is only step one. Converting the left-to-right Bow-Tie flow into a structured Bow-Tie Table lets risk managers:
- Link specific controls to an auditable Controls Register.
- Identify systemic gaps where critical threats lack documented safeguards.
- Assign clear ownership and evidence requirements for audit compliance.
From complexity to clarity:
- Visual & Communicative: Bridges the gap between executive leadership and operational staff.
- Systems & Gap Analysis: Instantly highlights single points of failure where controls are thin or missing.
- Repeatable & Standardised: Aligns seamlessly with major risk frameworks like ISO 31000, the Swiss Cheese Model, and Root Cause Analysis (RCA).
Whether you are protecting critical infrastructure or managing project risks, the Bow-Tie method transforms abstract uncertainty into a clear, actionable roadmap for prevention and recovery.
How to assess barrier effectiveness
Assessing and rating the effectiveness of barriers (controls) in a Bow-Tie analysis moves the diagram from a simple theoretical visual into an actionable, auditable risk management framework.
To rate a barrier accurately, practitioners evaluate it through three main dimensions: its hierarchy level, its operational attributes, and its performance rating.
1. The hierarchy of Controls
Before testing whether a barrier is working, evaluate its structural type. Highly automated or passive barriers are inherently more reliable than administrative ones.
2. Core evaluation criteria
To give a barrier a specific rating, ask four fundamental questions about its design and implementation:
- Independence: Does the barrier function completely independently of the threat, the central event, and other barriers? (If Barrier B fails whenever Barrier A fails, they are not independent).
- Functionality: Is the barrier designed to stop the entire threat or mitigate the entire consequence, or only a fraction of it?
- Availability / Reliability: Is the barrier available 100% of the time when needed? (e.g., Is a backup generator routinely tested?).
- Auditability: Can you produce physical, digital, or documentary evidence that the barrier is functioning as intended?
3. Standard rating scale for barrier effectiveness
In formal Bow-Tie frameworks (such as ISO 31000 implementations and platform standards), controls are typically assigned a qualitative rating:
| Effectiveness Rating |
Criteria |
Operational Reality |
| Fully Effective / Strong |
Well-designed, independent, fully automated or passive, tested regularly with verifiable audit evidence. |
Fails less than 1% of the time when triggered. |
| Substantially Effective / Satisfactory |
Good design, mostly independent, relies on minor human interaction, documented procedures, and routine maintenance. |
Functioning as intended, though minor escalation factors exist. |
| Partially Effective / Weak |
Poorly designed, heavily dependent on human behaviour without checks, or lacking documentation/testing. |
Frequently bypassed, delayed, or degraded by operating conditions. |
| Ineffective / Deficient |
Known design flaws, unmaintained hardware, ignored procedures, or failed past audits/incidents. |
Provides zero real protection; exists on paper only. |
| Untested / Unknown |
A new barrier or one where no audit evidence or performance logs exist. |
Must be treated as weak until verified. |
4. The role of escalation factors in barrier ratings
A control's rating is never static—it degrades over time due to Escalation Factors (conditions that weaken controls). To keep ratings accurate:
- Identify Escalation Factors: For a fire suppression system, an escalation factor might be corrosive saltwater environment or power loss.
- Verify Escalation Controls: Look at the secondary barriers protecting the primary control (e.g., weekly corrosion inspections or uninterruptible power supplies (UPS)).
- Adjust the Rating: If escalation controls are missing or unmonitored, downgrade the primary barrier's rating accordingly (e.g., from Fully Effective down to Partially Effective).
Practical application steps:
- Map the Controls: Place existing barriers on the left (preventative) and right (mitigation) wings of the Bow-Tie.
- Apply Colour-Coding: Visually flag barrier strength on your diagram (e.g., Green for Fully Effective, Yellow for Substantially/Partially Effective, Red for Ineffective).
- Identify Single Points of Failure: Look for critical threats or consequences defended by only a single Yellow or Red barrier—these represent your immediate risk priorities.
- Assign Control Owners: Ensure every barrier has a designated person responsible for maintaining its effectiveness rating through routine testing and auditing.
Software that takes these factors into account, such as Riskware, makes practical application faster and easier by helping teams map controls, assess barriers and create a clear pathway for decision-making and follow-up.
Linking Bow-Tie analysis to audit and compliance
Bow-Tie analysis becomes far more powerful when it is connected to the systems that govern assurance, testing and accountability across the organisation. On its own, a
Bow-Tie diagram provides a clear visual of threats, controls, escalation factors and consequences. But when each barrier is linked to audit activity, compliance obligations and evidence records, the model shifts from a static workshop output to a living decision framework.
This connection helps organisations do more than document risk. It enables teams to verify whether controls are operating as intended, identify where assurance is weak, and respond faster when barrier performance begins to degrade. For leadership, it also creates clearer and more reliable records, stronger accountability and Real-Time visibility into where risk exposure may be increasing.
Step 1: Assign unique Control IDs to every barrier
In a visual Bow-Tie, barriers are often represented as simple text boxes (e.g., "Routine Equipment Inspection"). To link them to a corporate register, every barrier must be treated as a unique data object with its own Control Reference ID.
- Format:
<Department>-<Asset/Risk>-CTRL-<Number>
- Example:
OPS-FIRE-CTRL-0104 (Offshore Fire Suppression Deluge Valve System)
This ID serves as the primary key across all enterprise software—connecting your Bow-Tie diagram, Asset Management System (e.g., SAP, Maximo), and Governance, Risk & Compliance (GRC) software.
Step 2: Establish the data mapping architecture
Map each Bow-Tie barrier to specific compliance and audit attributes within your enterprise register:
| Bow-Tie Attribute |
Corporate Audit & Register Field |
Example Data |
| Barrier ID & Name |
Control Reference & Description |
OPS-FIRE-CTRL-0104: Deluge System |
| Barrier Type |
Control Hierarchy / Category |
Active Hardware / Engineering |
| Control Owner |
Assigned Accountability (Role) |
Chief Safety Officer / Maintenance Lead |
| Current Effectiveness Rating |
Audit Performance Status |
Partially Effective (Yellow) |
| Escalation Controls |
Audit Verification Procedures |
PROC-AUD-088: Quarterly Valve Flow Test |
| Assigned Evidence |
Verification Artifact |
SCADA Test Logs, Pressure Certificates |
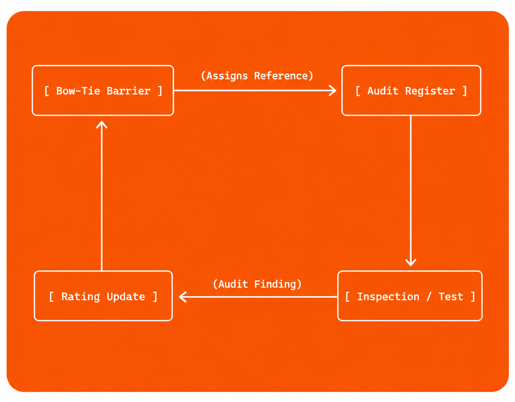
Step 3: Implement the 4-phase closed-loop process
To maintain an active connection between your Bow-Tie model and audit schedule, establish this four-step workflow:
1. Define Assurance Requirements
For every barrier rated Fully Effective or Substantially Effective, set a mandatory verification requirement in the audit register (e.g., "Must be inspected every 90 days with passing pressure test logs").
2. Execute Audit & Testing
Internal auditors or safety inspectors test the control using standardised checklists tied directly to the Barrier ID.
3. Automatically Trigger Rating Updates
When an audit produces a non-conformance finding (e.g., valve failed response time threshold during test), the audit register automatically flags the control.
The System Action: The control rating in the Bow-Tie diagram automatically downgrades from Fully Effective (Green) to Partially Effective (Yellow) or Ineffective (Red).
4. Drive Remediation & Escalation
A downgraded barrier automatically generates a Corrective Action Plan (CAP) in the audit system, assigning a deadline and owner to restore the control. Once re-audited and verified, the Bow-Tie rating returns to Green.
Step 4: Executive reporting & Key Risk Indicators (KRIs)
Once your Bow-Tie barriers and audit registers are linked, leadership receives real-time visibility into systemic risk exposure:
- Single Point of Failure Alerts: Highlight any critical Bow-Tie pathway where the primary barrier's audit status turns Red and no backup controls exist.
- Audit Coverage Ratio: Track the percentage of total Bow-Tie barriers audited within their required compliance window (e.g., "92% of critical barriers audited in Q2").
- Control Degradation Trends: Track how many controls dropped in effectiveness ratings following recent audit cycles to spot systemic maintenance or training issues before an incident occurs.
Why the Bow-Tie method matters across the organisation
What makes the Bow-Tie method especially valuable is that its usefulness extends far beyond the risk team. Because it shows threats, controls, escalation factors and consequences in one clear visual, it gives safety teams, auditors, operational leaders, compliance managers and executives a shared view of the same issue. That shared visibility supports better conversations, clearer accountability and faster decisions because each group can see where controls are strong, where assurance is weak and where action is needed.
Today, that value is being strengthened further by AI-powered capabilities. AI can help organisations surface patterns in incident data, identify emerging control weaknesses, connect actions and evidence, and support more consistent reviews of barrier effectiveness at scale. Used well, AI does not replace professional judgement. Instead, it helps teams work with clearer and more timely insight, making the Bow-Tie method an even more practical way to turn complex risk information into actionable insights and visibility for leadership. In practice, the Bow-Tie becomes more than a risk analysis tool; it becomes a common decision framework that connects strategy, assurance and frontline execution.