Visualise your risk exposure, track mitigation efforts and drive smarter, compliance-ready decisions.
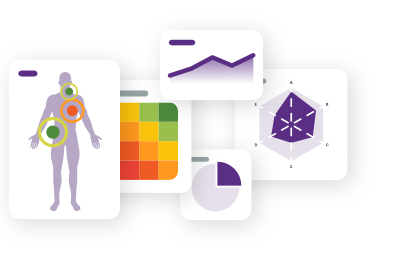
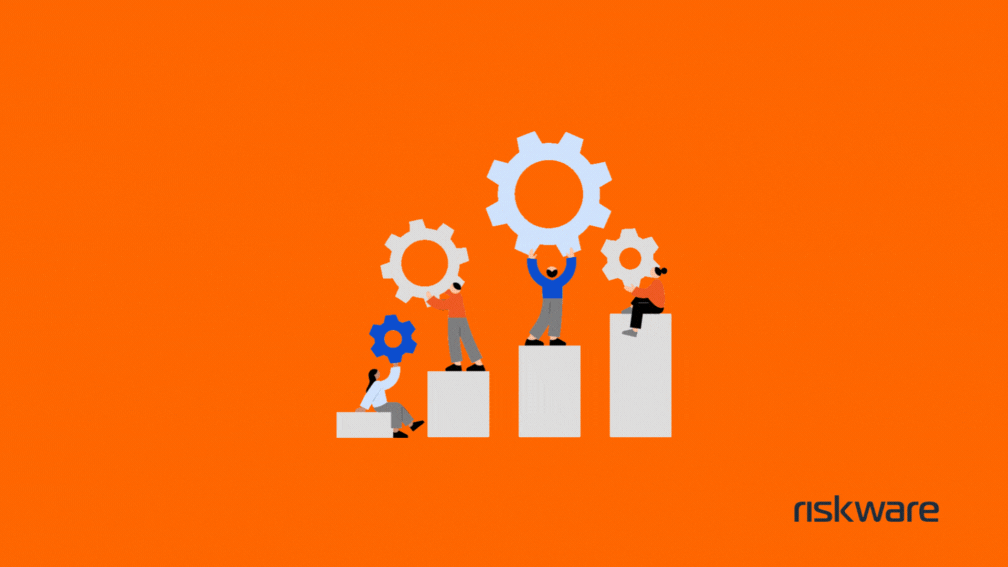
Managing risk isn’t just about identifying threats, it’s about understanding them, tracking their impact and communicating clearly across the business. The Analytics & Reporting Module within Riskware transforms scattered risk data into actionable intelligence. With real-time dashboards, custom reporting and deep analytics, your teams can identify patterns, prioritise mitigation and ensure leadership always has the insights needed to act with confidence..
Aggregate and analyse all risk data. From operational and compliance risks to cybersecurity threats in one unified view.
Visualise key safety KPIs such as LTIFR, TRIFR, near-misses and open corrective actions all in a central, real-time view.
Create tailored dashboards for risk owners, safety managers, executives and other stakeholders so everyone can track what matters most to them.
With a comprehensive set of out-of-the-box reports, stakeholders can easily filter data by location, incident type, risk level, date range and more empowering them to make well-informed, data-driven decisions.
It automates time-consuming tasks, such as risk assessments, incident analysis, and control monitoring, freeing your team to focus on strategic initiatives.
Build customised views. Setup default dashboards for users to provide instant visibility into metrics and data most relevant to their role.
In-built Report Designer. Select from pre-built reports or build your own. No coding required with Riskware’s intuitive drag-and-drop tool.
Board & Executive reports. Pre-configured board reports offer senior managers a clear, real-time view of key risks, incident trends and performance indicators ensuring confident, data-driven decision-making at the leadership level.
Realtime access. Easily integrate with third party business intelligence tools such as Power BI or Tableau in realtime.
Marc Brownlie
Wesley Mission Queensland